Incendiary and Temperature Effects of Nuclear Bomb testing REAL REASON FOR GLOBAL 'WARMING'. HELL MAYBE
THEME GREEN BOOTS; MY LITTLE THEORY ON CLIMATE CHANGE ADDS UP
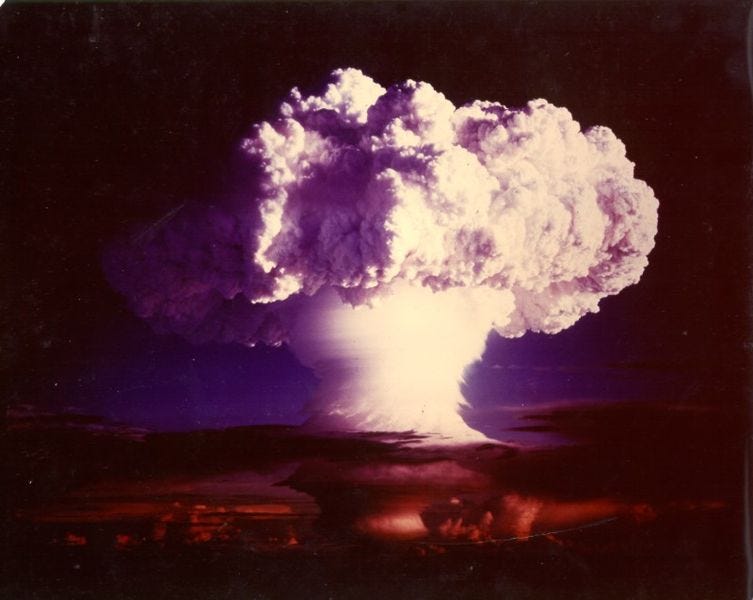
Image from Nuclear Museum
THIS piece is larger than the email version and must be viewed on substack.
Oceans’ sudden temperature spike stumps and alarms scientists
By Seth Borenstein The Associated Press you can find it anywhere.
But what you can’t find is just a little bit of logical examination of OUR WORLD.
Remember scientists are often ‘alarmed and stumped’. Like when they look at SADS or immune escape. Scientific ‘consensus’ as explained by the media tends to result in: simultaneous talking points, face muzzles, ( visual metaphors for speech muzzle laws) LOCK DOWNS, WEAPONIZED BURAUCRACY, ELIMINATION OF RIGHTS, ABSURDITIES, LAWS passed against citizens' interests.
What if there is a massive element in the climate change equation not yet factored in? URANIUM.
According to Theodore A Postol, PH.D. of Stanford University, Stanford, California in Possible Fatalities from Superfires Following Nuclear Attacks in or Near Urban Areas
“During the period of peak energy output, a 1-megaton (Mt) nuclear weapon can produce temperatures of about 100 million degrees Celsius at its center, about four to five times that which occurs at the center of the Sun.
Because the Sun's surface is only about 6,000°C and it heats the Earth's surface from a range of more than 90 million miles (about 145 million kin), it should be clear that such a nuclear detonation would be accompanied by enormous emanations of light and heat.
So great is the amount of light and heat generated by a 1-Mt airburst, that if one were to occur at a high enough altitude over Baltimore, observers in Washington, D.C., might see it as a ball of fire many times brighter than the noonday Sun. Even if such a detonation were to occur near dawn over Detroit, out of line of sight because of the Earth's curvature, enough light could well be scattered and refracted by atmospheric effects for it to be observed as a glare in the sky from Washington, D.C.
This intense light and heat from nuclear detonations is capable of setting many simultaneous fires over vast areas of surrounding terrain. These fires, once initiated, could efficiently heat large volumes of air near the Earth's surface. As this heated air buoyantly rises, cool air from regions beyond the vast burning area would rush in to replace it. Winds at the ground could reach hurricane force, and air temperatures within the zone of fire could exceed that of boiling water.
The ferocious hurricane of fire would also be accompanied by the release of large amounts of potentially lethal toxic smoke and combustion gases, creating an environment of extreme heat, high winds, and toxic agents in target areas.”
So Hot. Pretty hot. Inflammatory hot.
And has this been happening? Alot. a lot OF LOTS HOT. lots of alot. HOT.
http://nuclearsecrecy.com/nukemap/ This Nuke Map site is interactive although ‘not secure’.
According to Alex Wellerstein on this above site OVER 298.1 MILLION DETONATIONS OF NUCLEAR BOMBS AND COUNTING.
I’m not sure he is right.
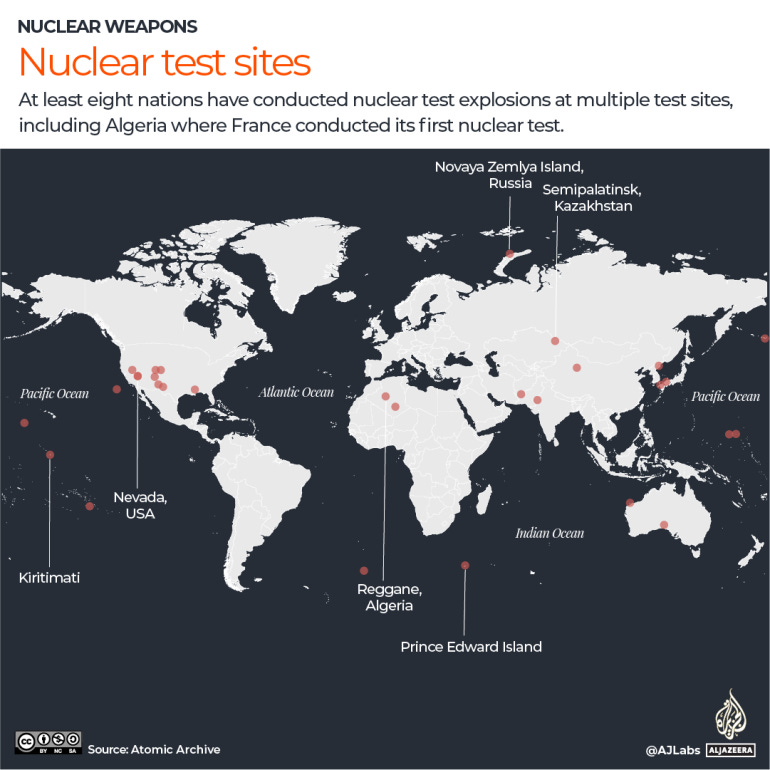
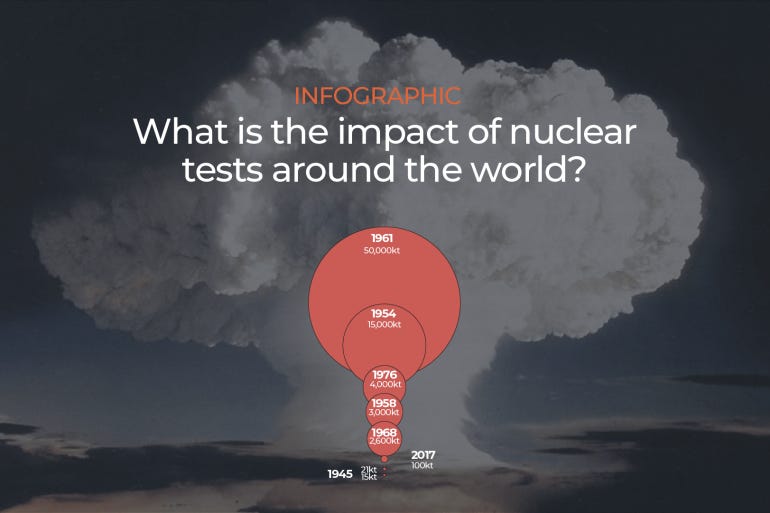
Aljazeera “Which countries have carried out nuclear tests?
According to the Arms Control Association, at least eight countries have carried out a total of 2,056 nuclear tests since 1945.”
either way when you factor in how dramatic the energy release is (transferred to heat, or kinetic within the oceans) it IS MASSIVE AMOUNT OF CREATION HUMAN -CAUSED HEAT. Theoretically you could calculate the totality of megatons in bombs and create an equation for THE MEGA HEAT RELEASE.
Image from Aljazeera
SO WHAT’S THE EFFECT OF ALL THOSE MEGATONS BEING BOMBED INTO OCEANS…MEGA RELEASE OF energy and HEAT.
SO LET ME SUGGEST TO YOU AN ALTERNATE NOT POSITED THEORY ON GLOBAL WARMING/CLIMATE CHANGE THAT DOESN’T INVOLVE YOU HAVING A LITTLE C02 TRACKER. or driving an electric vehicle.
TAKE ALOT HOT AND ALOT OF DETONATIONS.
BADABING. BADABOOM. I can’t be the first person to add this up logically. Right? So why isn’t this one of the possible scientific lines of inquiry. consensus that ignores this big of a scientific gap in theory, seems like a bombshell to me. (groan)
I wonder what that does to Ocean temperatures. Or fish population for that matter.
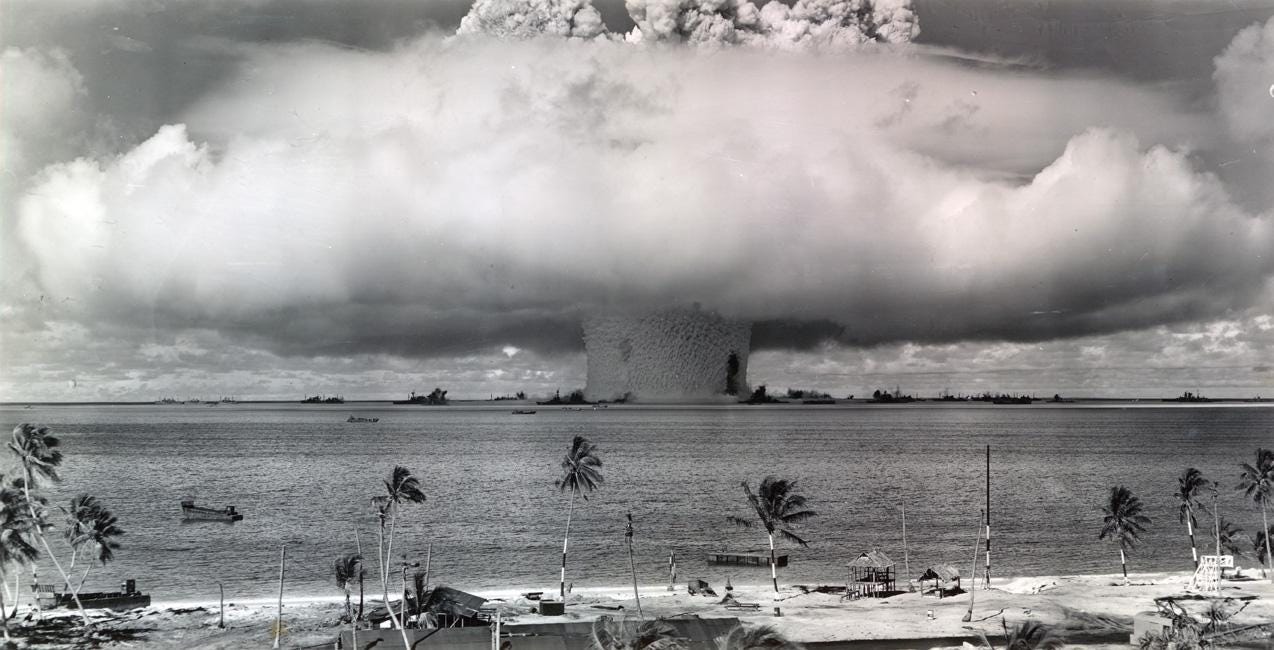
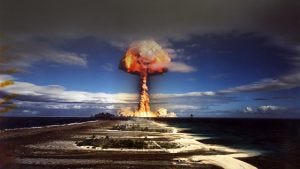
Atomic testing at Bikini Atoll, 1946. Lawrence Rausch Papers (AC393), Box 3.
According to Nulcear Museum
“Between 1946 and 1958, the United States conducted 67 nuclear tests in the Marshall Islands. The U.S. conducted 23 of these tests at Bikini Atoll, and 44 near Enewetak Atoll, but fallout spread throughout the Marshall Islands.
During the post-World War II period the U.S. expanded their nuclear research and development programs. The U.S. government established the Atomic Energy Commission (AEC) to monitor the peacetime development of atomic science and technology. Fear of the Soviet Union increasing their atomic weapons, and the belief that building up nuclear arms could help establish U.S. power, contributed to this rapid expansion.”
Consider also whether there is a ‘release’ of heat from the earth/ lava/ and the effect on seismic activity like volcanos that can result. There’s the heat, then the secondary heat. Ok I’ll get rid of my gas stove? hahahahaha. you’ve got to be kidding.
“Nuclear activities in the Arctic over the last 50 years
Numerous nuclear explosions have taken place in the Arctic. One of the largest military nuclear testing facilities is on the island of Novaya Zemlya, where from 1955 through to 1990 the Soviet Union detonated 88 atmospheric, 29 underground, and 3 underwater nuclear devices. Dozens of civilian 'peaceful nuclear explosions' have also occurred in the Russian Arctic, where nuclear bombs were used into the late 1980's for seismic studies, mining, and in attempts to extinguish oil-field fires.”
Year: 2006
From collection: Vital Arctic Graphics (2004 edition)
Do you think Ice might melt at all after a nuclear bomb? Naaaaa. Conspiracy theorist. I’m sure New York will tell its citizens to drink martinis on the rocks as their next Public Service Announcement: nuclear warning video. Just like NY on COVID: GET INSIDE; STAY INSIDE; STAY TUNED AND NOW GET UNDER ICE.
or is it just possible nuclear bombs in the artic are responsible for melted glaciers.
Timeline of Major Nuclear Tests Conducted at the Marshall Islands:
7/1/1946: Testing begins at the Marshall Islands, with Shot Able.
7/25/1946: Shot Baker is conducted, under Operation Crossroads.
4/30/1948: Shot Yoke, under Operation Sandstone, is conducted. This was the first fission weapon to use a levitated core design.
4/20/1951: Shot Easy nuclear test is conducted at Enewetak Atoll, under Operation Greenhouse. The Easy test was meant to test a new, lighter implosion bomb.
5/1951: Operation Greenhouse testing occurred at Enewetak Atoll.
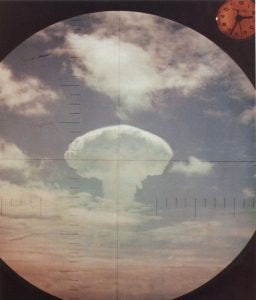
11/1/1952: The Mike Shot is conducted at Enewetak, under Operation Ivy. This was the first U.S. thermonuclear test.
6/28/1958: The Oak test is conducted, at Enewetak Atoll, under the Operation Hardtack I series. This was the 6th largest U.S. nuclear test. Hardtack I included 35 total tests. Hardtack I was the last testing series conducted on the Marshall Islands.
Also according to Nuclear Museum Here:
February 13, 1960 France tests its first atomic bomb.
July 20, 1960 The U.S. tests the first submarine-launched ballistic missile (SLBM).
March 14, 1961 A B-52 crashes near Yuba City, California, jettisoning two nuclear weapons.
October 30, 1961 The Soviet Union detonates Tsar Bomba, the largest nuclear device in human history. The weapon yielded 57 megatons of TNT, four times larger than any nuclear device tested by the United States. The amount of explosive energy released by Tsar Bomba amounted to all of the explosives used during World War II multiplied by ten!
May 6, 1962 Shot Frigate Bird is the only US ballistic missile tested with a live nuclear warhead.
May 8, 1962 US military conducts Shot Yukon of Operation Dominic, a 100 kiloton fission bomb.
July 17, 1962 The US conducts its last atmospheric nuclear test during Operation Storax.
October 16, 1962 The Cuban Missile Crisis begins after surveillance photos taken by a routine U-2 flight over Cuba show Soviet Medium-Range Ballistic Missiles on the island.
October 18, 1962 US military conducts Shot Chama of Operation Dominic, a relatively light weight, small diameter hydrogen bomb meant to fit onto an ICBM. The weapon yielded 1.6 megatons.
June 10, 1963 In his commencement address at American University, President John F. Kennedy announces that “high-level discussions will shortly begin in Moscow looking toward early agreement on a comprehensive test ban treaty.” He declares, “The United States does not propose to conduct nuclear tests in the atmosphere so long as other states do not do so.”
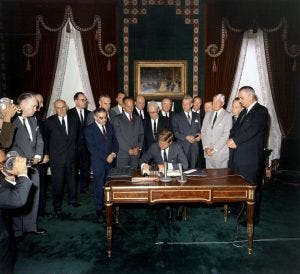
October 10, 1963 The Limited Test Ban Treaty, signed by JFK and Nikita Khrushchev, enters into effect. The LTBT bans all nuclear weapons tests above ground, in the atmosphere, underwater, and in outer space.
October 16, 1964 China tests its first atomic bomb.
January 17, 1966 A B-52 crashes over Palomares, Spain, dropping four hydrogen bombs. Of the four Mk28 type hydrogen bombs the B-52 carried, three were found on land near the small fishing village of Palomares. The non-nuclear explosives in two of the weapons detonated upon impact with the ground, resulting in the contamination of roughly 1 square mile area by plutonium. The fourth, which fell into the Mediterranean Sea, was recovered intact after nearly a 3-month-long search.
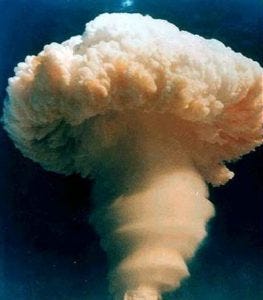
June 17, 1967 China tests its first hydrogen bomb. It was a fully functional, three-stage hydrogen bomb, tested just 32 months after China had made its first fission device. China thus produced the shortest fission-to-fusion development known in history.
January 21, 1968 A B-52 carrying four hydrogen bombs crashes in Greenland, causing the conventional explosives aboard to detonate and the nuclear payload to rupture and disperse, which resulted in radioactive contamination.
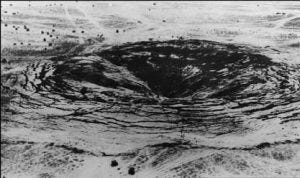
March 12, 1968 The United States conducts the Buggy nuclear test underground at the Nevada Test Site as part of the Operation Crosstie series. Also part of Operation Plowshare, an effort to use nuclear explosives for peaceful construction purposes, Buggy involved the simultaneous detonation of five nuclear devices to excavate a channel. Each yielded 1.1 kilotons.
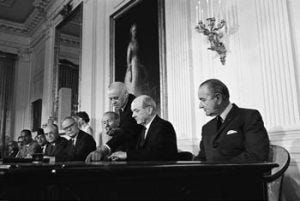
July 1, 1968 Nuclear Non-Proliferation Treaty is opened for signature. A total of 190 parties have joined the Treaty since 1968, with five states being recognized as nuclear-weapon states: the United States, Russia, the United Kingdom, France, and China (also the five permanent members of the United Nations Security Council).
August 24, 1968 France tests its first hydrogen bomb, code named Canopus, at the Fangataufa atoll. The device was suspended from a large hydrogen filled balloon and produced a 2.6 megaton yield at an altitude of 1800 feet. As a result of the successful detonation, France became the 5th thermonuclear nation.
December 8, 1968 The United States conducts the Schooner nuclear test underground at the Nevada Test Site as part of the Operation Bowline series. “Schooner” was also part of Operation Plowshare, an effort to use nuclear explosives for peaceful construction purposes. The test yielded 30 kilotons.
March 5, 1970 The Nuclear Non-Proliferation Treaty signed two years earlier enters into force. The treaty allowed sharing of atomic technology for “peaceful purposes” to non-nuclear nations under the agreement that these nations would never develop an atomic weapons program.
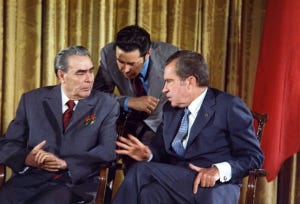
May 26, 1972 US President Richard Nixon and Soviet Premier Leonid Brezhnev sign the Anti-Ballistic Missile Treaty (ABM) and the first Strategic Arms Limitation Treaty (SALT), both of which were important steps in slowing the nuclear arms race between the US and the USSR.
May 18, 1974 India tests its first “peaceful nuclear device” (PNE), dubbed Smiling Buddha. The Smiling Buddha was the first confirmed nuclear test by a nation outside the five permanent members of the United Nations Security Council.
April 7, 1978 Production of “neutron bomb” is cancelled by US President Jimmy Carter. The Neutron bomb is a type of thermonuclear weapon designed specifically to release a large portion of its energy as energetic neutron radiation (fast neutrons) rather than explosive energy. Although their extreme blast and heat effects are not eliminated, it is the enormous radiation released by ERWs that is designed to be a major source of casualties.
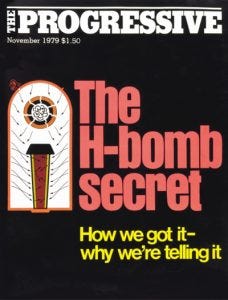
March 9, 1979 Temporary injunction granted by US court against The Progressive Magazine for attempting to publish designs for H-bomb. The story contained information about the still-classified “Teller-Ulam” design principle and configuration.
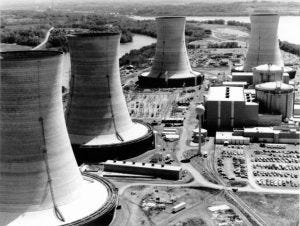
March 28, 1979 A partial nuclear meltdown occurs in one of the two United States Three Mile Island nuclear reactors in Dauphin County, Pennsylvania. The partial meltdown resulted in the release of small amounts of radioactive gases and radioactive iodine into the environment. It was the worst accident in U.S. commercial nuclear power plant history.
September 22, 1979 The US Vela satellite records a “double-flash” characteristic of a nuclear weapons test off the coast of South Africa. The test is believed to be conducted by either South Africa or Israel, however the incident remains a mystery to this day.
March 11, 1983 Pakistan begins sub-critical testing series for nuclear weapons.
September 26, 1983 Soviet Stanislav Petrov, the duty officer at the command center for the Oko nuclear early-warning system, narrowly averts nuclear war when the system reported a missile being launched from the United States. Petrov judged that the report was a false alarm. This decision is credited with having prevented an erroneous retaliatory nuclear attack on the United States, which could have resulted in large-scale nuclear war. Investigation later confirmed that the satellite warning system had malfunctioned.
November 2, 1983 A 10-day NATO training exercise, known as Able Archer 83, begins in Casteau, north of the Belgian city of Mons. The USSR feared that the US would actually launch a preemptive nuclear attack during the exercise.
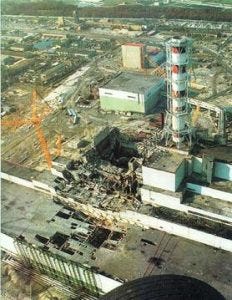
April 26, 1986 A catastrophic nuclear accident occurs at the Chernobyl Nuclear Power Plant in Ukraine, which was under the direct jurisdiction of the central authorities of the Soviet Union. An explosion and fire released large quantities of radioactive particles into the atmosphere, which spread over much of the western USSR and Europe.
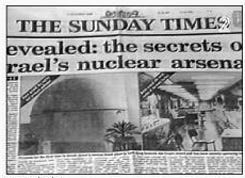
October 5, 1986 The London Sunday Times publishes photos provided by defected Dimona worker Mordechai Vanunu revealing the Israeli nuclear program.”
The timeline extends to present and you can visit the site for more information. But what I’m really trying to present is that the detonations of these bombs create a tremendous amount of energy and heat. FURTHER three been a steady stream of them during the time period that climate alarmists went from warming about the next ice age to global warming to well …CHANGE. which is absurd in that it means a non static state.
According to Alex Wellerstein here:
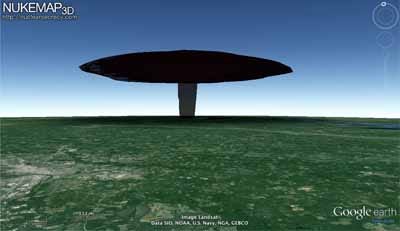
“In 2015-2016, Google discontinued the support and operation of the Google Earth Browser Plugin. This was the core technology that allowed NUKEMAP3D to function.
As of this writing (2019), there are no viable replacements for the Google Earth Browser Plugin currently available (that is, there are no in-browser, publicly-accessible APIs that duplicate whole-Earth coverage of buildings and allow developers to import their own model files dynamically). If a viable replacement becomes available, NUKEMAP3D will return.
What did NUKEMAP3D do and look like?
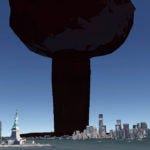
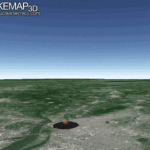
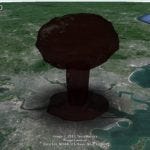
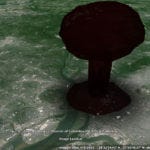
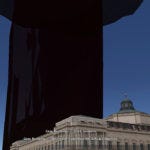
NUKEMAP3D was a mashup between the NUKEMAP and the Google Earth Browser Plugin, created by Alex Wellerstein in 2013. It allowed a user to see the ground effects of a nuclear weapon over any city in the world in 3D, as well as render a size-accurate mushroom cloud for any given yield of nuclear weapon. The goal was to help give a human understanding of nuclear weapons detonations: everyone has seen photographs of nuclear mushroom clouds, but few people have any sense of how large they actually are. Even a "small" nuclear weapon (by modern standards), like those used over the cities of Hiroshima and Nagasaki, is many times larger than anything human beings have ever built. By engaging the third dimension, something more intuitive triggers in the brain, even more so than the 2D representations possible in the original NUKEMAP.
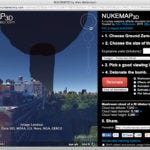
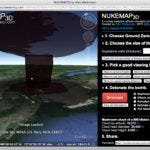
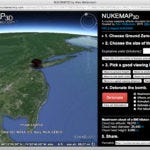
Some screenshots from NUKEMAP3D have been preserved (click to see full-sized):
20 kilotons on Manhattan, viewed airplane height
20 kilotons on mid-town Manhattan, as viewed from nearer to the surface, with the Statue of Liberty and downtown Manhattan for scale
20 kilotons on Manhattan (animated GIF; you could have the cloud rise in real-time, which would take about 10 minutes)
20 kilotons on Boston, viewed from airplane height
20 kilotons on Washington, DC, viewed from airplane height
20 kilotons on Washington, DC, viewed from the Library of Congress
20 kilotons on downtown Manhattan, as viewed from the New York Academy of Medicine (upper east side), with the application interface visible
800 kilotons on New York City, as viewed from airplane height at a substantial distance
800 kilotons on New York City, as as viewed from Low Earth Orbit (i.e., the International Space Station)
A very high yield detonation (I don't remember the exact yield; probably at least 10 megatons), as seen from a very far distance, demonstrating both its great height but also how high yield detonations had extremely wide mushroom tops. One of my favorite demonstrations of NUKEMAP3D was to show that if atmospheric conditions were unrealistically clear, the mushroom cloud from a 1 megaton detonation in Washington, DC, would be visible from the torch in the Statue of Liberty.
For more information about the creation of the code, see the NUKEMAP FAQ.
What alternatives to NUKEMAP3D exist?
At the moment, the only easy alternative is to use the NUKEMAP's experimental KMZ output option. To use it, set up any detonation(s) you want to view in 3D in NUKEMAP, and then, click on "Advanced Options":”
All these Advanced Options in terms of incredible heat and energy output and we don’t have it in the climate change equation. What’s wrong with Greta? Al Gore et al?
It’s like PV = NRT without the P or e = mc squared without the speed of light.
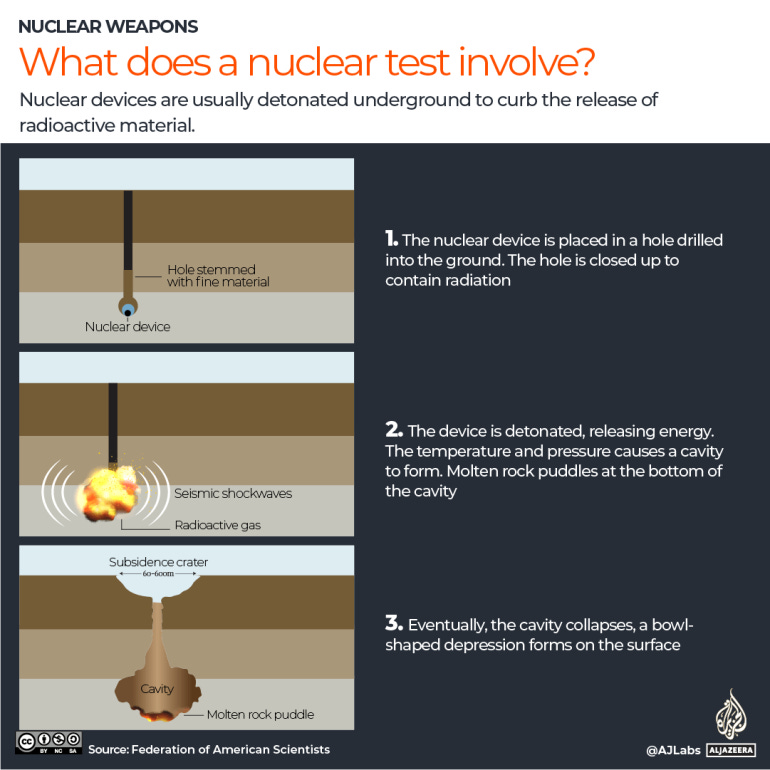
Image from Aljazeera
So weird they calculate ‘radiation’ but NEVER HEAT, or ENERGY which transfers to HEAT, or release of SECONDARY HEAT. The silence is deafening me again. THIS IS HOW I SEE OUR WORLD. Give it a shout out.
If you don’t mind sharing and subscribing or upgrading your subscription, I would appreciate.




Having done a 700 page scientific paper on the scam of AGW, I am well aware of Seth Boring-stein. Or is that Seth DeepStateStein? This guy is an intellectual lightweight and an utter embarrassment to climatologists everywhere. To wit:
Since I am no longer affiliated with any organization nor receiving any funding, I can speak quite frankly….As a scientist I remain skeptical.” - Atmospheric Scientist Dr. Joanne Simpson, the first woman in the world to receive a PhD in meteorology and formerly of NASA who has authored more than 190 studies and has been called “among the most preeminent scientists of the last 100 years.”
“Inevitably in climate science, when data conflicts with models, a small coterie of scientists can be counted upon to modify the data...That the data should always need correcting to agree with models is totally implausible and indicative of a certain corruption within the climate science community.” Dr. Richard Lindzen, professor of atmospheric science, MIT
Claude Allegre, a “founding father of AGW theory,” has now come out against this, stating “The cause of this climate change is unknown.”
“What historians will definitely wonder about in future centuries is how deeply flawed logic, obscured by shrewd and unrelenting propaganda, actually enabled a coalition of powerful special interests to convince nearly everyone in the world that carbon dioxide from human industry was a dangerous, planet-destroying toxin. “It will be remembered as the greatest mass delusion in the history of the world - that carbon dioxide, the life of plants, was considered for a time to be a deadly poison.”— Richard Lindzen, professor emeritus of atmospheric science, MIT. Source https://www.sec.gov/comments/climate-disclosure/cll12-8855233-238421.pdf
Lindzen also wrote “The notion of a static, unchanging climate is foreign to the history of the Earth or any other planet with a fluid envelope. Such hysteria (over global warming) simply represents the scientific illiteracy of much of the public, the susceptibility of the public to the substitution of repetition for truth.”
Dr Roy Spencer, a principal research scientist at the University of Alabama in Huntsville, has indicated that out of the 21 climate models tracked by the IPCC the differences in warming exhibited by those models is mostly the result of different strengths of positive cloud feedback – and that increasing CO2 is insufficient to explain global-average warming in the last 50 to 100 years.
Dr. William Happer, professor emeritus of physics at Princeton University, ”There isn’t a climate crisis. There will not be a climate crisis. It is utter nonsense.” https://www.sec.gov/comments/climate-disclosure/cll12-8855233-238421.pdf
Piers Corbin, astrophysicist, founder of Weather Action, 2002 said that current weather patterns have nothing to do with man-made climate change. Instead, Corbin flatly states that those pushing this narrative are just trying to make money. “Climate has always been changing,” and “this has nothing to do with man.” Weather this year is “caused by circulation patterns… and CO2 does not cause circulation patterns. What causes those is a combination of solar activity and the phases of the moon” ; the only connection with man is that he is “here at the same time the sun and the moon are doing things. A very similar situation happened about 132 years ago where there was the same sun, magnetic, lunar states (and) there was a heat wave in Russia and floods in Pakistan as now. These things are dictated by solar activity and the moon and nothing to do with mankind. Those who say that are just trying to make money… I assure you, this has nothing to do with carbon dioxide” In his words, see here, 2:27 min.
“The climate scare (is) the biggest deception in history…”Dr. Tim Ball, environmental consultant and former climatology professor at the University of Winnipeg in Manitoba
Warming fears are the “worst scientific scandal in the history…When people come to know what the truth is, they will feel deceived by science and scientists.” - UN IPCC Japanese Scientist Dr. Kiminori Itoh, an award-winning PhD environmental physical chemist.
“The IPCC has actually become a closed circuit; it doesn’t listen to others. It doesn’t have open minds… I am really amazed that the Nobel Peace Prize has been given on scientifically incorrect conclusions by people who are not geologists,” - Indian geologist Dr. Arun D. Ahluwalia at Punjab University and a board member of the UN-supported International Year of the Planet.
“Creating an ideology pegged to carbon dioxide is a dangerous nonsense…The present alarm on climate change is an instrument of social control, a pretext for major businesses and political battle. It became an ideology, which is concerning.” - Environmental Scientist Professor Delgado Domingos of Portugal, the founder of the Numerical Weather Forecast group, has more than 150 published articles.
“The models and forecasts of the UN IPCC "are incorrect because they only are based on mathematical models and presented results at scenarios that do not include, for example, solar activity.” - Victor Manuel Velasco Herrera, a researcher at the Institute of Geophysics of the National Autonomous University of Mexico
“It is a blatant lie put forth in the media that makes it seem there is only a fringe of scientists who don’t buy into anthropogenic global warming.” - U.S Government Atmospheric Scientist Stanley B. Goldenberg of the Hurricane Research Division of NOAA.
“Even doubling or tripling the amount of carbon dioxide will virtually have little impact, as water vapour and water condensed on particles as clouds dominate the worldwide scene and always will.” – . Geoffrey G. Duffy, a professor in the Department of Chemical and Materials Engineering of the University of Auckland, NZ.
“After reading [UN IPCC chairman] Pachauri's asinine comment [comparing skeptics to] Flat Earthers, it's hard to remain quiet.” - Climate statistician Dr. William M. Briggs, who specializes in the statistics of forecast evaluation, serves on the American Meteorological Society's Probability and Statistics Committee and is an Associate Editor of Monthly Weather Review. (Note: there really IS a Flat Earth Society, at http://www.theflatearthsociety.org/cms/, whose president Daniel Shenton, thinks “the evidence suggests fossil fuel usage is contributing to global warming.” (See www.tinyurl.com/ozn2wfe. So much for Obama’s comment that “We don’t have time for a meeting of the Flat Earth Society.”
“For how many years must the planet cool before we begin to understand that the planet is not warming? For how many years must cooling go on?" - Geologist Dr. David Gee the chairman of the science committee of the 2008 International Geological Congress who has authored 130 plus peer reviewed papers, and is currently at Uppsala University in Sweden.
The recent World Climate Declaration signed by around 250 university professors, and led by a Nobel physics laureate, noted that models had many shortcomings, “and are not remotely plausible as global policy tools” This declaration notes that natural as well as anthropogenic factors cause warming, warming is far slower than predicted, climate policy relies on inadequate models, CO2 is plant food, the basis of all life on Earth, global warming has not increased natural disasters, and that climate policy must respect scientific and economic realities. Here are all the PhD signatories.
“The present era is one of the coolest and least carbon-intensive periods of the last 600 million years. Indeed, the geological and paleontological evidence overwhelmingly says that today’s average global temperature of about 15 degrees C and CO2 concentrations of 420 ppm are nothing to fret about, and even if they rise to about 17-18 degrees C and 500-600 ppms by the end of the century, it may well on balance improve the lot of mankind. After all, bursts of civilization during the last 10,000 years uniformly occurred during the red portion of the graph below–the river civilizations, the Minoan, the Greco-Roman era, the Medieval flowering and the industrial and technological revolutions of the present era. At the same time, the several lapses into dark ages happened when the climate turned colder (blue area). And that’s only logical. When its warmer and wetter, growing seasons are longer and crop yields are better—regardless of the agricultural technology and practices of the moment. And it’s better for human and community health, too—most of the deadly plagues of history have occurred under colder climes, such as the Black Death of 1344-1350 … (the warmers narrative) ignores the entirety of the planet’s pre-Holocene (last 10,000 years) history, even though the science shows that more than 50% of the time in the last 600 million years global temperatures were in the range of 25 degrees C or 67% higher than current levels and far beyond anything projected by the most unhinged climate models today. But, crucially, at those temperature peaks planetary climate systems did not go into a doomsday loop of scorching meltdown—warming was always checked and reversed by powerful counter-veiling forces.” David Stockman, former Director of the Office of Management and Budget under President Ronald Reaga
Amazing - opened my eyes just a little wider. Thanks.